Let’s talk about what sets a top-tier radiator fan apart from the rest, beyond the basic figures of maximum RPM, CFM, and SP. This article will equip you with knowledge on the key design elements and performance metrics that contribute to cooling efficiency. Discover the essential aspects that define the best radiator fans and how they can benefit your computing experience. Buckle up, people. This is a nerdy one.
DEMYSTIFYING THE TERMS: CFM, SP, AND A THIRD METRIC NOBODY TOLD YOU ABOUT
CFM: Your Fan's Breathing Capability
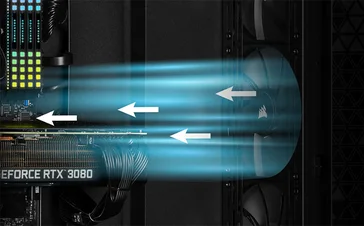
- CFM, or Cubic Feet per Minute, is essentially how much air your fan can move. It's like measuring how well your fan can take deep breaths and exhale, circulating air through your PC's innards to whisk away the heat.
SP: The Muscle Behind the Movement
- Static Pressure (SP) is the fan's ability to push air through resistance – think of it as the force you can put into blowing air through a straw. It's crucial when the air must move through dense areas like heatsinks or radiators.
Impedance: Your radiator fins push back
- Without accounting for radiator impedance, all CFM and SP data might tell you are theoretical values of a fan’s performance in either completely unobstructed mounting (airflow) or blowing against a solid surface (static pressure). Cute, but that’s not how you’re going to cool your CPU.
Why Max RPM Metrics Aren't the Whole Story
- Those impressive max CFM and SP numbers? Your fan won't always (and shouldn't always) be running at full tilt. Not only that, but every fan behaves differently at various RPMs. Fan construction and design can optimize to perform better at some speeds than others, and if the fan was built to charm you with its 100% PWM performance numbers, that doesn’t mean it’ll do well at speeds where you actually use it. Theoretical peaks are below:
And the actual CFM and SP your fan delivers mounted on a radiator at 100% speed is here:
THE REAL-WORLD DYNAMICS OF FAN PERFORMANCE: BEYOND THE NUMBERS
- Maximum speed equals maximum noise. If you're like most people, you prefer your PC cool but not sound like a wind tunnel. This is where understanding fan performance at different RPMs becomes crucial.
- Fan performance curves aren't linear. A fan who’s a champ at 2,000+ RPM might not be your best performer at half that speed.
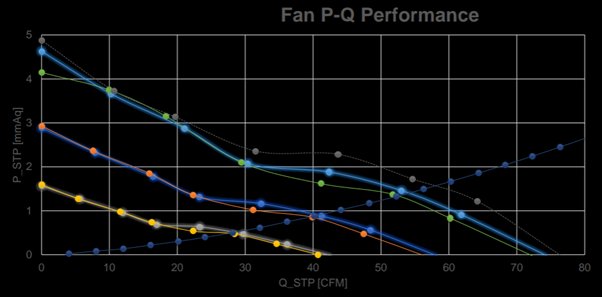
Here’s an example of multiple fans, with their blade shape, material, and housing changes delivering different performances. A typical fan project will go through dozens of iterations, looking for the optimal outcome.
Picking the right fan is about balancing CFM for airflow and SP for overcoming resistance. But there's another factor – noise. It's the dance of finding a fan that cools effectively and keeps the decibels down.
APPLYING THE SCIENCE TO YOUR PC: WHY IT MATTERS IN PRACTICE
The fan you choose based on its varied speed performance is what defines your daily experience. A quieter fan that shines at speeds your cooling curve usually hovers at means a more pleasant gaming session or workday. It's about creating an environment that's comfortable for you.
Tips for Selecting the Perfect Fan
- Look for fans with a good balance between high CFM and adequate SP.
- Pay attention to noise ratings – dB levels are often listed on the packaging.
- Consider the build quality and brand reputation for longer-lasting performance.
So, that's the gist of it, but we can go deeper...
UNRAVELLING THE SCIENCE OF PC COOLING
If you ever felt like you weren’t getting the whole picture when looking at fan performance data, you were probably correct. Let’s unravel the complexities and nuances of radiator fan technology and measurement that define optimal PC cooling.
In this comprehensive guide, we'll dissect the key concepts of CFM (Cubic Feet per Minute), SP (Static Pressure), and impedance, all of which play pivotal roles in the effectiveness of your computer's cooling system. Whether you're a seasoned builder or new to the world of PC assembly, it can’t hurt to improve your understanding and appreciation of what it takes to keep your computer running cool and efficiently.
HOW CHARTS ARE CONSTRUCTED
Constructing performance charts involves meticulous testing. Fans are tested at various RPMs, and measurements of airflow and pressure are plotted to create these charts.
These charts show the relationship between CFM, SP, and RPM, providing a visual representation of a fan’s performance under different conditions.
INTERPRETING PERFORMANCE CHARTS: WHERE SCIENCE MEETS REAL-WORLD PERFORMANCE
When you're looking at a fan performance chart, you're not just seeing lines and numbers; you're seeing a visual narrative of how a fan will behave in real-life scenarios. These charts are more than just tools for comparison; they're the roadmap to understanding a fan's efficiency under varying conditions.
The Intersection Point: Where Theory Meets Practice
- The most crucial aspect of these charts is the point where the CFM/SP curve intersects with the radiator impedance curve. This intersection represents the actual performance you can expect from a fan on a radiator at a specific speed.
- It's important to understand that this intersection is where the fan's theoretical capabilities translate into practical performance. The CFM/SP curve indicates potential, but it's at the intersection with the radiator's impedance curve that potential turns into reality.
Non-linearity of CFM/SP Curves: Understanding the Bumps and Dips
- Another key thing to remember is that these curves are never linear. This non-linearity means that a fan's actual performance doesn't increase or decrease uniformly based on its theoretical maximum values or with speed changes. For example, a development change in a new fan design might deliver a significant increase in maximum static pressure, but sadly, either remain the same or worse when mounted on a radiator.
- In practice, achieving optimal results involves manipulating the fan's design to create 'bumps' in the CFM/SP curve at points where it intersects with the radiator impedance curve. These bumps represent areas of increased efficiency and performance.
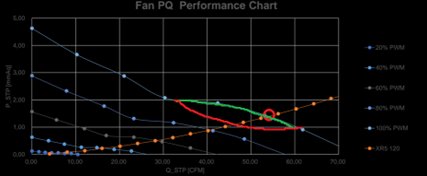
An example of a good and worse fan performance curve with assumed identical maximum CFM and SP values below:
Curve Shaping
- Developing these bumps in the curve is a delicate balance of engineering and design. It involves adjusting various fan attributes, such as blade angle, shape, and the fan’s motor characteristics, to tweak the performance curve.
- The goal is to engineer the fan in such a way that at a wide range of speeds (fans increase and decrease PWM as needed), the fan's performance curve exhibits a bump right where it intersects with the radiator impedance curve. This results in enhanced efficiency and cooling performance where it matters most.
Reading the Charts: A Step-by-Step Guide
- Identify the Curves: First, locate the CFM and SP curves on the chart. These are usually roughly parallel for various fan speeds. The impendance curve is a single opposite curve, and that represents the fixed influence of the radiator on the SP and airflow.
- Find the Intersection Point: Next, find where these curves intersect with the radiator impedance curve. This point tells you the fan's performance at a given speed.
- Look for Bumps in the Curve: Observe the shape of the CFM/SP curves. Where you see a bump at the intersection point, you’re looking at a zone of heightened efficiency. The only bump or dip that matters is the one in the area of intersection, as that is the performance measured for that specific radiator.
- Analyze the Efficiency Zone: Consider how these bumps align with your typical usage speeds. A fan might have a great bump at high speeds, but if you’re aiming for quieter operation at lower speeds, focus on the curve characteristics in that range. In general you’ll find that airflow and SP measurements only start deviating at medium to higher speeds.
By understanding how to read these charts and interpret the intersection points and curve shapes, you can make informed decisions about which fan will best suit your cooling needs. This understanding goes beyond mere specifications; it's about matching the fan's performance profile with your specific cooling requirements, ensuring that your PC not only runs cool but does so efficiently and quietly, matching your usage patterns and preferences.
Now that you're an expert on reading complex fan performance data, you'll know exactly which CORSAIR fans you'll need for your build. Check out our new iCUE LINK RX fans, and all the other fans we make over at our main website.