

This post is also available in Español, Deutsch, Português, Français, 한국어, 繁體中文, 日本語 and 简体中文.

Welcome to the 18th edition of the Cloudflare DDoS Threat Report. Released quarterly, these reports provide an in-depth analysis of the DDoS threat landscape as observed across the Cloudflare network. This edition focuses on the second quarter of 2024.
With a 280 terabit per second network located across over 320 cities worldwide, serving 19% of all websites, Cloudflare holds a unique vantage point that enables us to provide valuable insights and trends to the broader Internet community.
Key insights for 2024 Q2
- Cloudflare recorded a 20% year-over-year increase in DDoS attacks.
- 1 out of every 25 survey respondents said that DDoS attacks against them were carried out by state-level or state-sponsored threat actors.
- Threat actor capabilities reached an all-time high as our automated defenses generated 10 times more fingerprints to counter and mitigate the ultrasophisticated DDoS attacks.
View the interactive version of this report on Cloudflare Radar.
Quick recap - what is a DDoS attack?
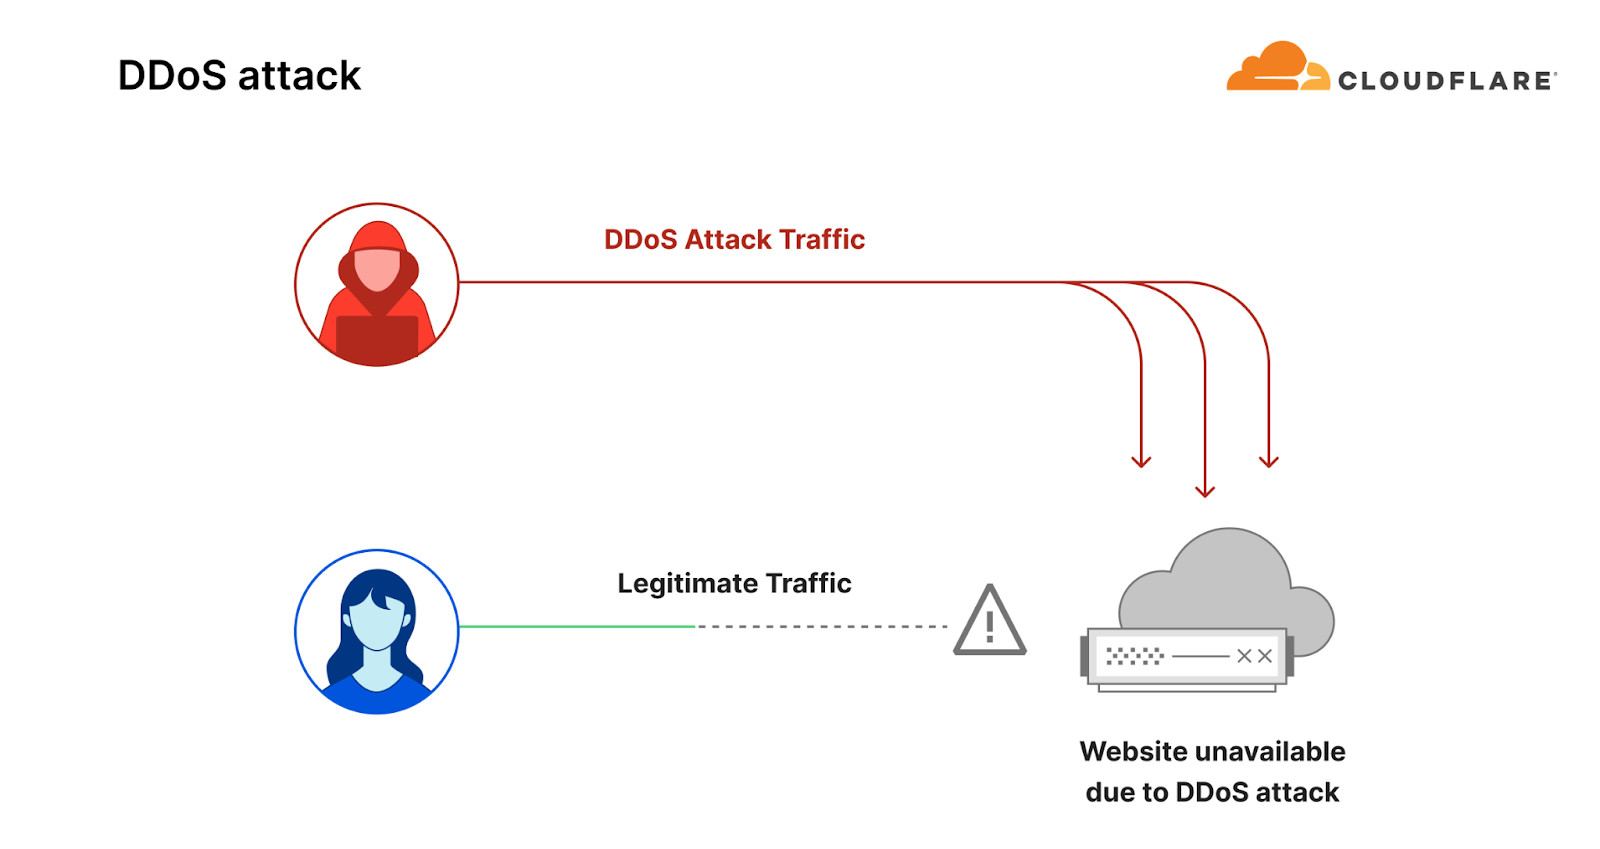
Before diving in deeper, let's recap what a DDoS attack is. Short for Distributed Denial of Service, a DDoS attack is a type of cyber attack designed to take down or disrupt Internet services, such as websites or mobile apps, making them unavailable to users. This is typically achieved by overwhelming the victim's server with more traffic than it can handle — usually from multiple sources across the Internet, rendering it unable to handle legitimate user traffic.
To learn more about DDoS attacks and other types of cyber threats, visit our Learning Center, access previous DDoS threat reports on the Cloudflare blog or visit our interactive hub, Cloudflare Radar. There's also a free API for those interested in investigating these and other Internet trends.
To learn about our report preparation, refer to our Methodologies.
Threat actor sophistication fuels the continued increase in DDoS attacks
In the first half of 2024, we mitigated 8.5 million DDoS attacks: 4.5 million in Q1 and 4 million in Q2. Overall, the number of DDoS attacks in Q2 decreased by 11% quarter-over-quarter, but increased 20% year-over-year.
For context, in the entire year of 2023, we mitigated 14 million DDoS attacks, and halfway through 2024, we have already mitigated 60% of last year’s figure.
Cloudflare successfully mitigated 10.2 trillion HTTP DDoS requests and 57 petabytes of network-layer DDoS attack traffic, preventing it from reaching our customers’ origin servers.

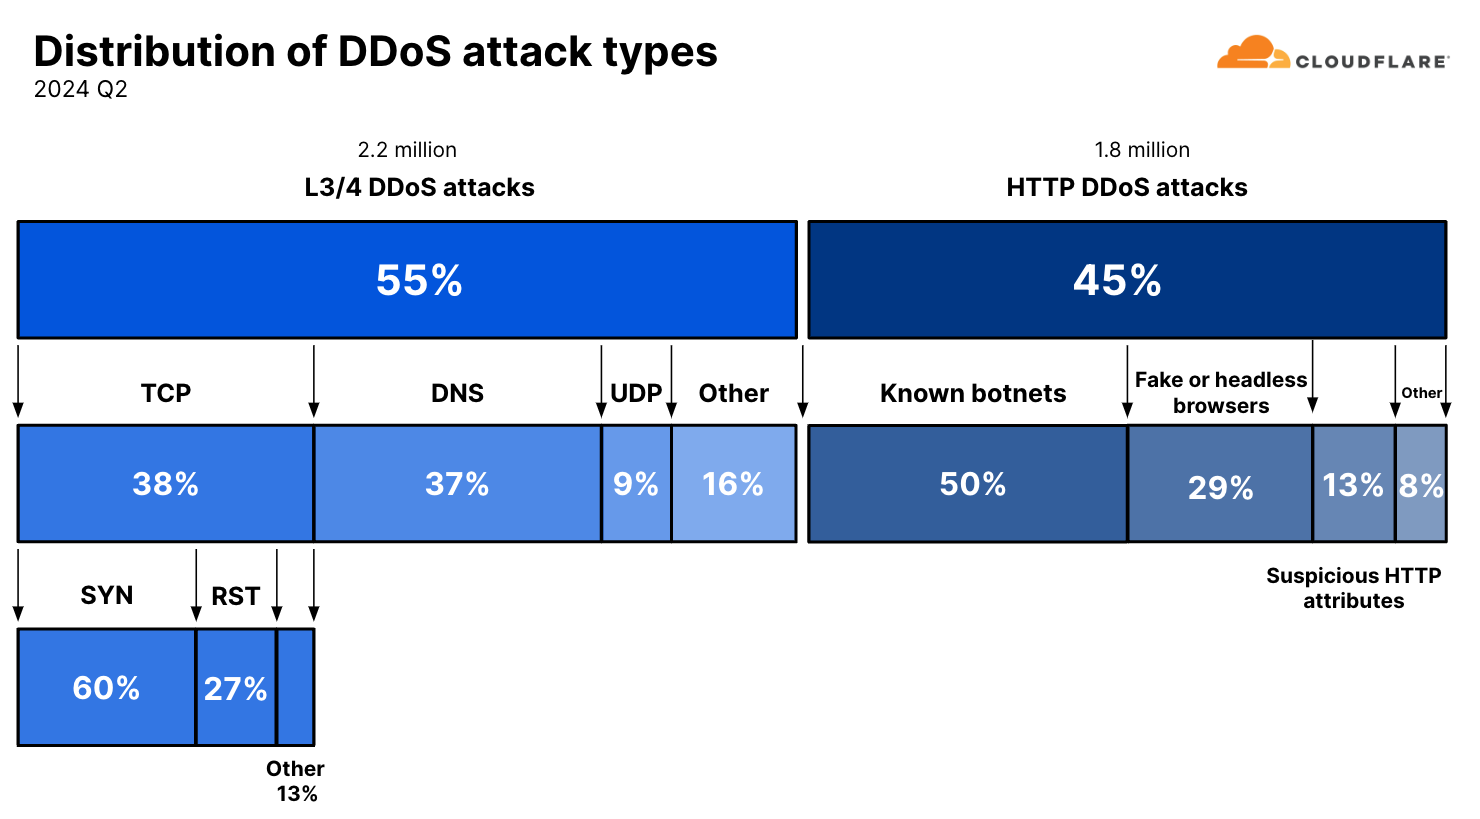
When we break it down further, those 4 million DDoS attacks were composed of 2.2 million network-layer DDoS attacks and 1.8 million HTTP DDoS attacks. This number of 1.8 million HTTP DDoS attacks has been normalized to compensate for the explosion in sophisticated and randomized HTTP DDoS attacks. Our automated mitigation systems generate real-time fingerprints for DDoS attacks, and due to the randomized nature of these sophisticated attacks, we observed many fingerprints being generated for single attacks. The actual number of fingerprints that was generated was closer to 19 million – over ten times larger than the normalized figure of 1.8 million. The millions of fingerprints that were generated to deal with the randomization stemmed from a few single rules. These rules did their job to stop attacks, but they inflated the numbers, so we excluded them from the calculation.

This ten-fold difference underscores the dramatic change in the threat landscape. The tools and capabilities that allowed threat actors to carry out such randomized and sophisticated attacks were previously associated with capabilities reserved for state-level actors or state-sponsored actors. But, coinciding with the rise of generative AI and autopilot systems that can help actors write better code faster, these capabilities have made their way to the common cyber criminal.
Ransom DDoS attacks
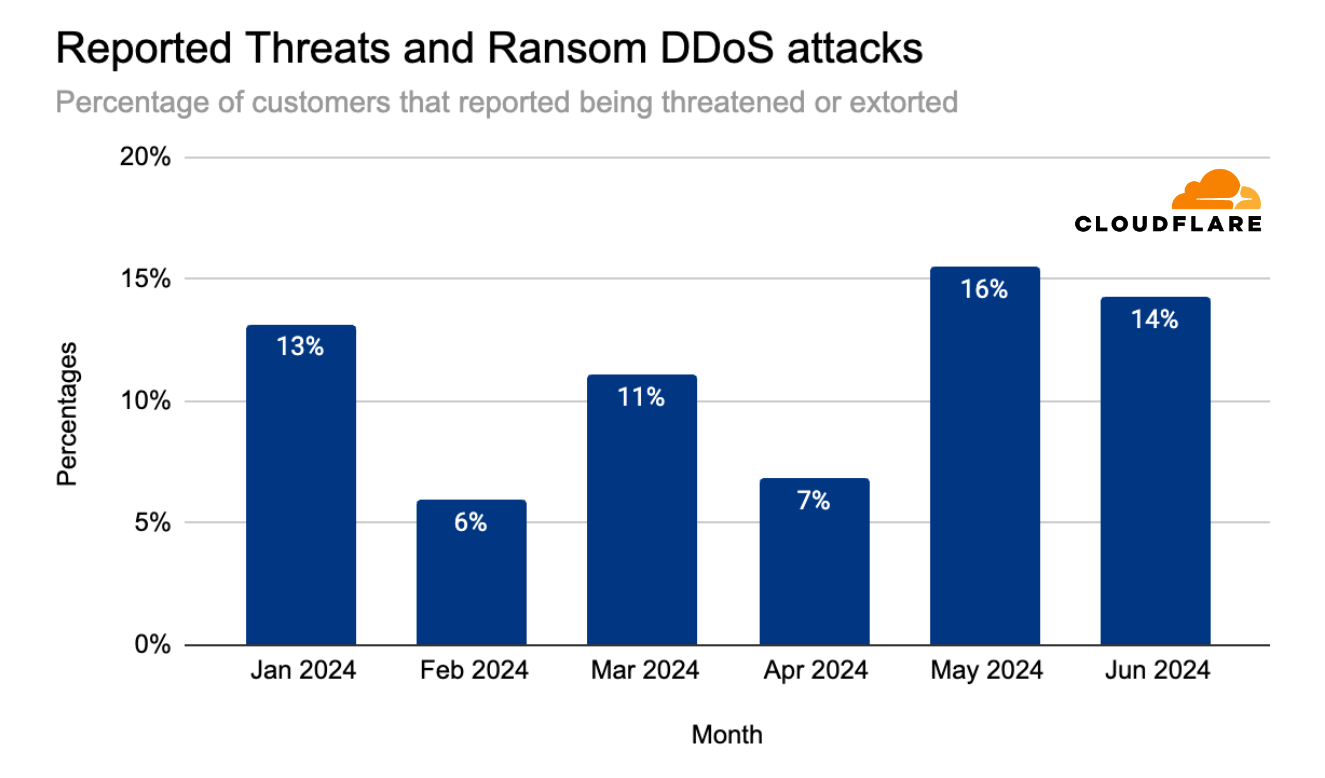
In May 2024, the percentage of attacked Cloudflare customers that reported being threatened by a DDoS attack threat actor, or subjected to a Ransom DDoS attack reached 16% – the highest it’s been in the past 12 months. The quarter started relatively low, at 7% of customers reporting a threat or a ransom attack. That quickly jumped to 16% in May and slightly dipped in June to 14%.
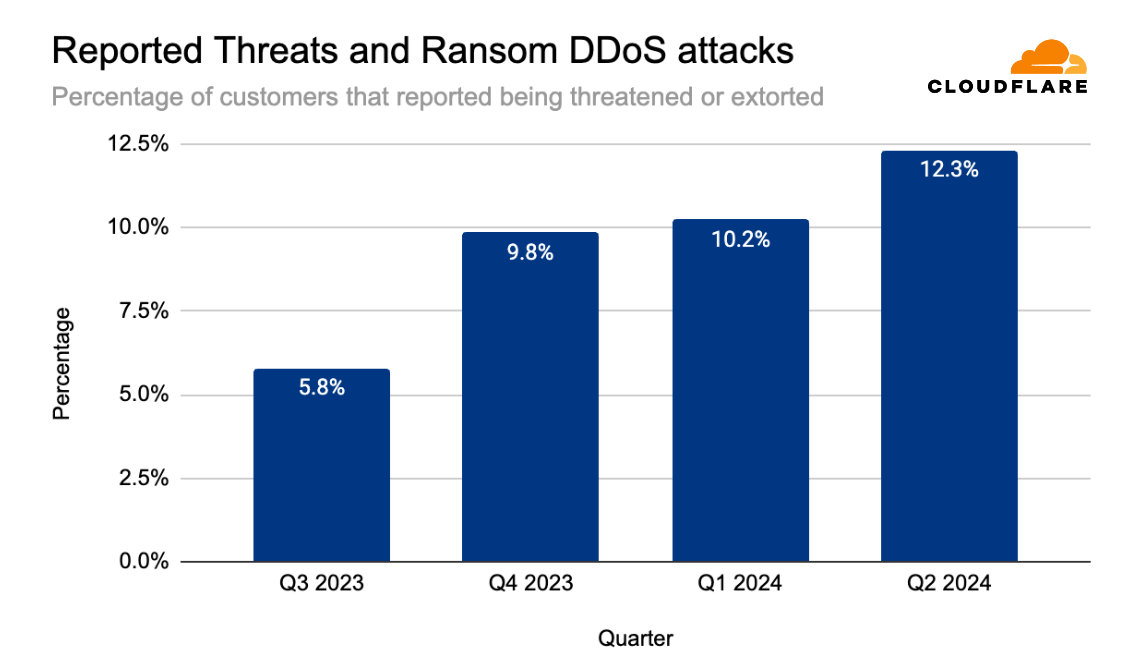
Overall, ransom DDoS attacks have been increasing quarter over quarter throughout the past year. In Q2 2024, the percentage of customers that reported being threatened or extorted was 12.3%, slightly higher than the previous quarter (10.2%) but similar to the percentage of the year before (also 12.0%).
Threat actors
75% of respondents reported that they did not know who attacked them or why. These respondents are Cloudflare customers that were targeted by HTTP DDoS attacks.
Of the respondents that claim they did know, 59% said it was a competitor who attacked them. Another 21% said the DDoS attack was carried out by a disgruntled customer or user, and another 17% said that the attacks were carried out by state-level or state-sponsored threat actors. The remaining 3% reported it being a self-inflicted DDoS attack.

Top attacked countries and regions
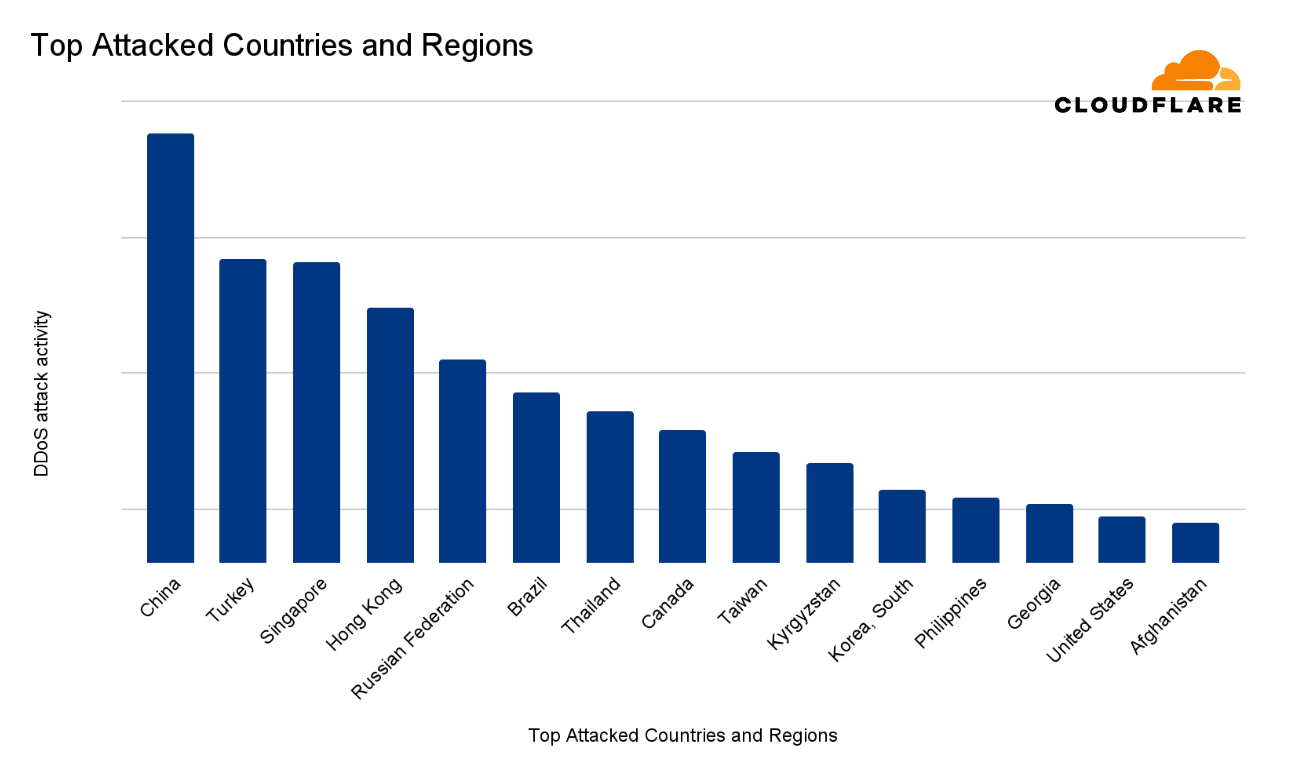
In the second quarter of 2024, China was ranked the most attacked country in the world. This ranking takes into consideration HTTP DDoS attacks, network-layer DDoS attacks, the total volume and the percentage of DDoS attack traffic out of the total traffic, and the graphs show this overall DDoS attack activity per country or region. A longer bar in the chart means more attack activity.
After China, Turkey came in second place, followed by Singapore, Hong Kong, Russia, Brazil, and Thailand. The remaining countries and regions comprising the top 15 most attacked countries are provided in the chart below.
Most attacked industries
The Information Technology & Services was ranked as the most targeted industry in the second quarter of 2024. The ranking methodologies that we’ve used here follow the same principles as previously described to distill the total volume and relative attack traffic for both HTTP and network-layer DDoS attacks into one single DDoS attack activity ranking.
The Telecommunications, Services Providers and Carrier sector came in second. Consumer Goods came in third place.
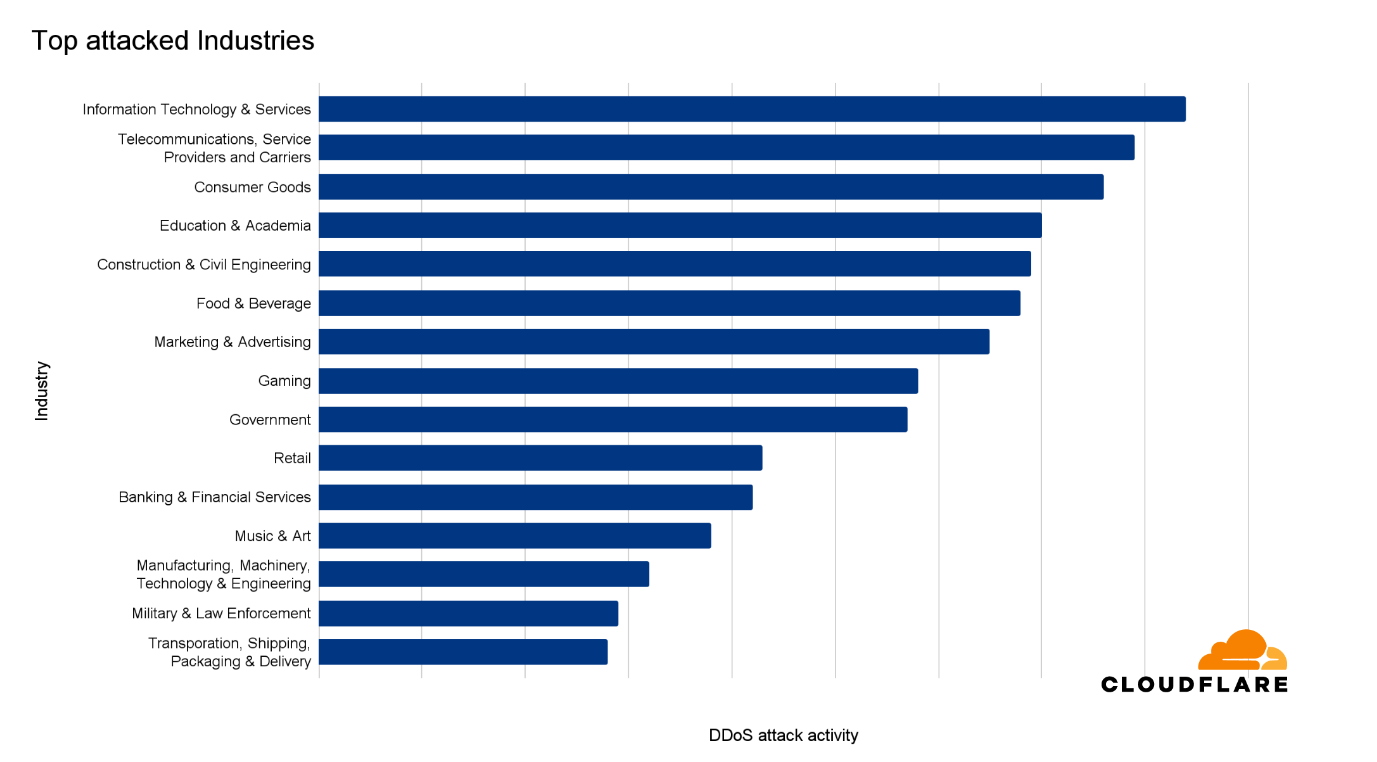
When analyzing only the HTTP DDoS attacks, we see a different picture. Gaming and Gambling saw the most attacks in terms of HTTP DDoS attack request volume. The per-region breakdown is provided below.

Largest sources of DDoS attacks
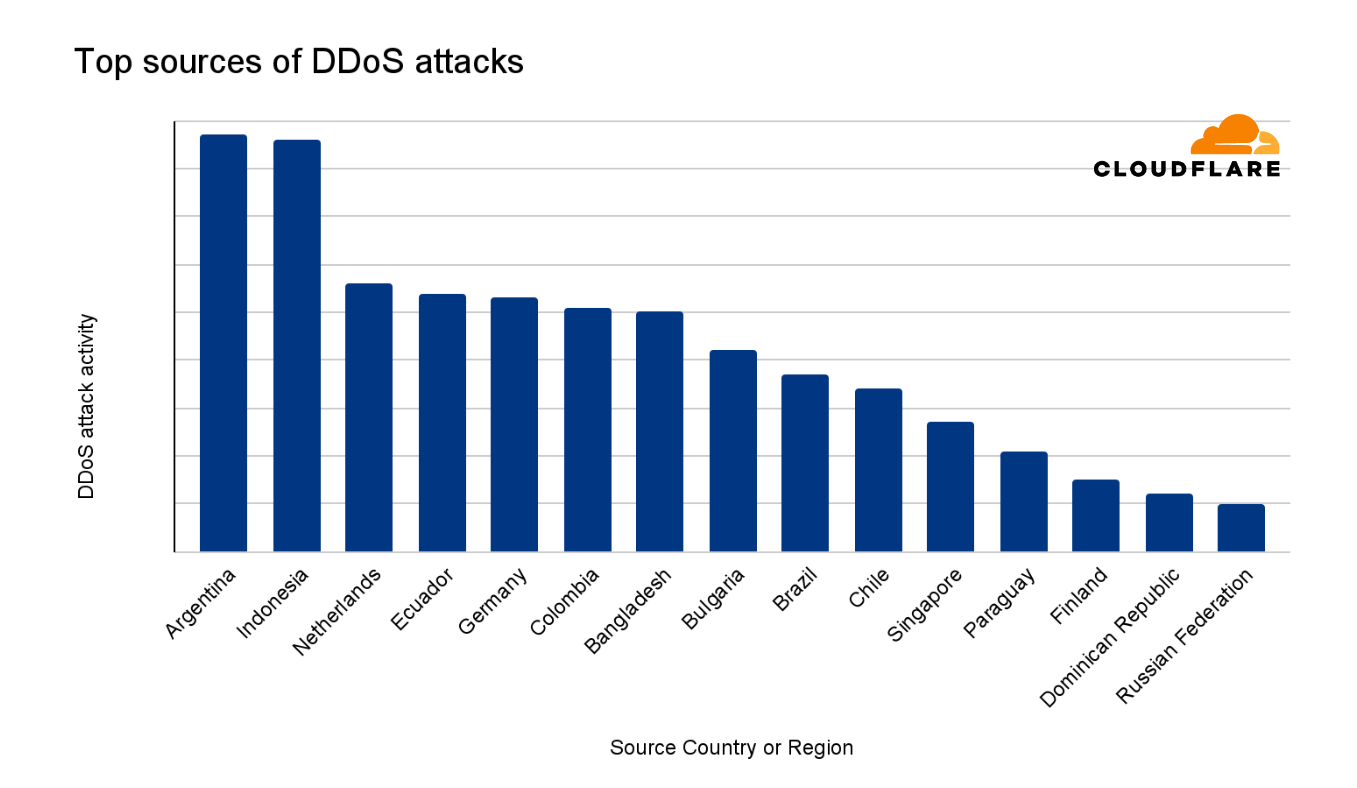
Argentina was ranked as the largest source of DDoS attacks in the second quarter of 2024. The ranking methodologies that we’ve used here follow the same principles as previously described to distill the total volume and relative attack traffic for both HTTP and network-layer DDoS attacks into one single DDoS attack activity ranking.
Indonesia followed closely in second place, followed by the Netherlands in third.
DDoS attack characteristics
Network-layer DDoS attack vectors
Despite a 49% decrease quarter-over-quarter, DNS-based DDoS attacks remain the most common attack vector, with a combined share of 37% for DNS floods and DNS amplification attacks. SYN floods came in second place with a share of 23%, followed by RST floods accounting for a little over 10%. SYN floods and RST floods are both types of TCP-based DDoS attacks. Collectively, all types of TCP-based DDoS attacks accounted for 38% of all network-layer DDoS attacks.

HTTP DDoS attack vectors
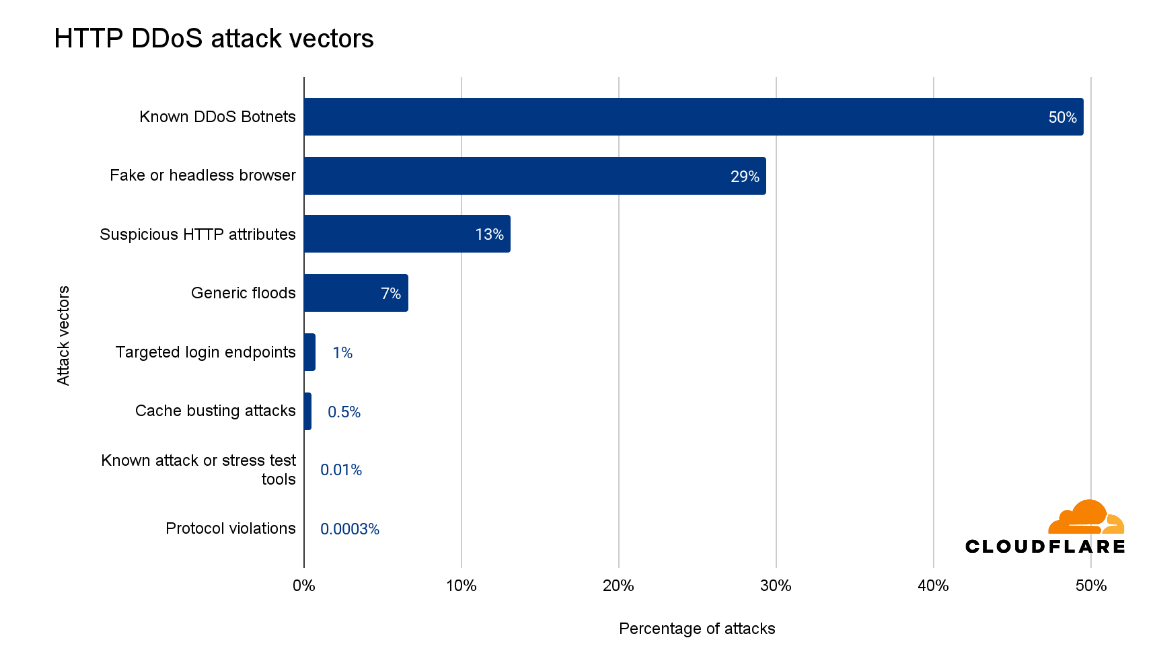
One of the advantages of operating a large network is that we see a lot of traffic and attacks. This helps us improve our detection and mitigation systems to protect our customers. In the last quarter, half of all HTTP DDoS attacks were mitigated using proprietary heuristics that targeted botnets known to Cloudflare. These heuristics guide our systems on how to generate a real-time fingerprint to match against the attacks.
Another 29% were HTTP DDoS attacks that used fake user agents, impersonated browsers, or were from headless browsers. An additional 13% had suspicious HTTP attributes which triggered our automated system, and 7% were marked as generic floods. One thing to note is that these attack vectors, or attack groups, are not necessarily exclusive. For example, known botnets also impersonate browsers and have suspicious HTTP attributes, but this breakdown is our initial attempt to categorize the HTTP DDoS attacks.
HTTP versions used in DDoS attacks
In Q2, around half of all web traffic used HTTP/2, 29% used HTTP/1.1, an additional fifth used HTTP/3, nearly 0.62% used HTTP/1.0, and 0.01% for HTTP/1.2.

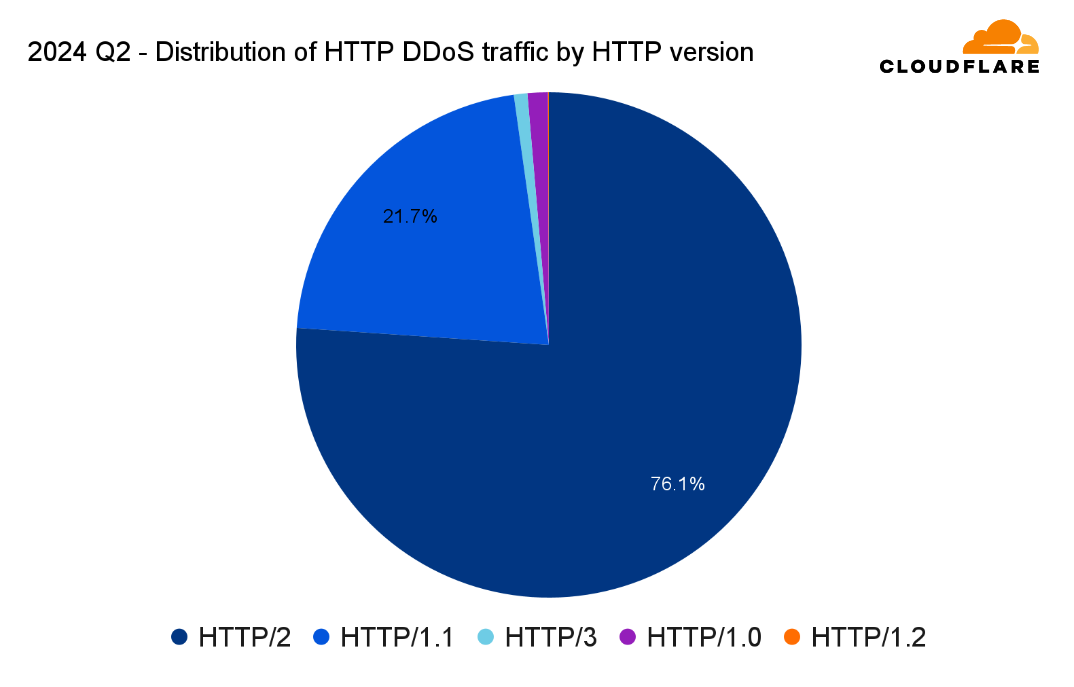
HTTP DDoS attacks follow a similar pattern in terms of version adoption, albeit a larger bias towards HTTP/2. 76% of HTTP DDoS attack traffic was over the HTTP/2 version and nearly 22% over HTTP/1.1. HTTP/3, on the other hand, saw a much smaller usage. Only 0.86% of HTTP DDoS attack traffic were over HTTP/3 — as opposed to its much broader adoption of 20% by all web traffic.
DDoS attack duration
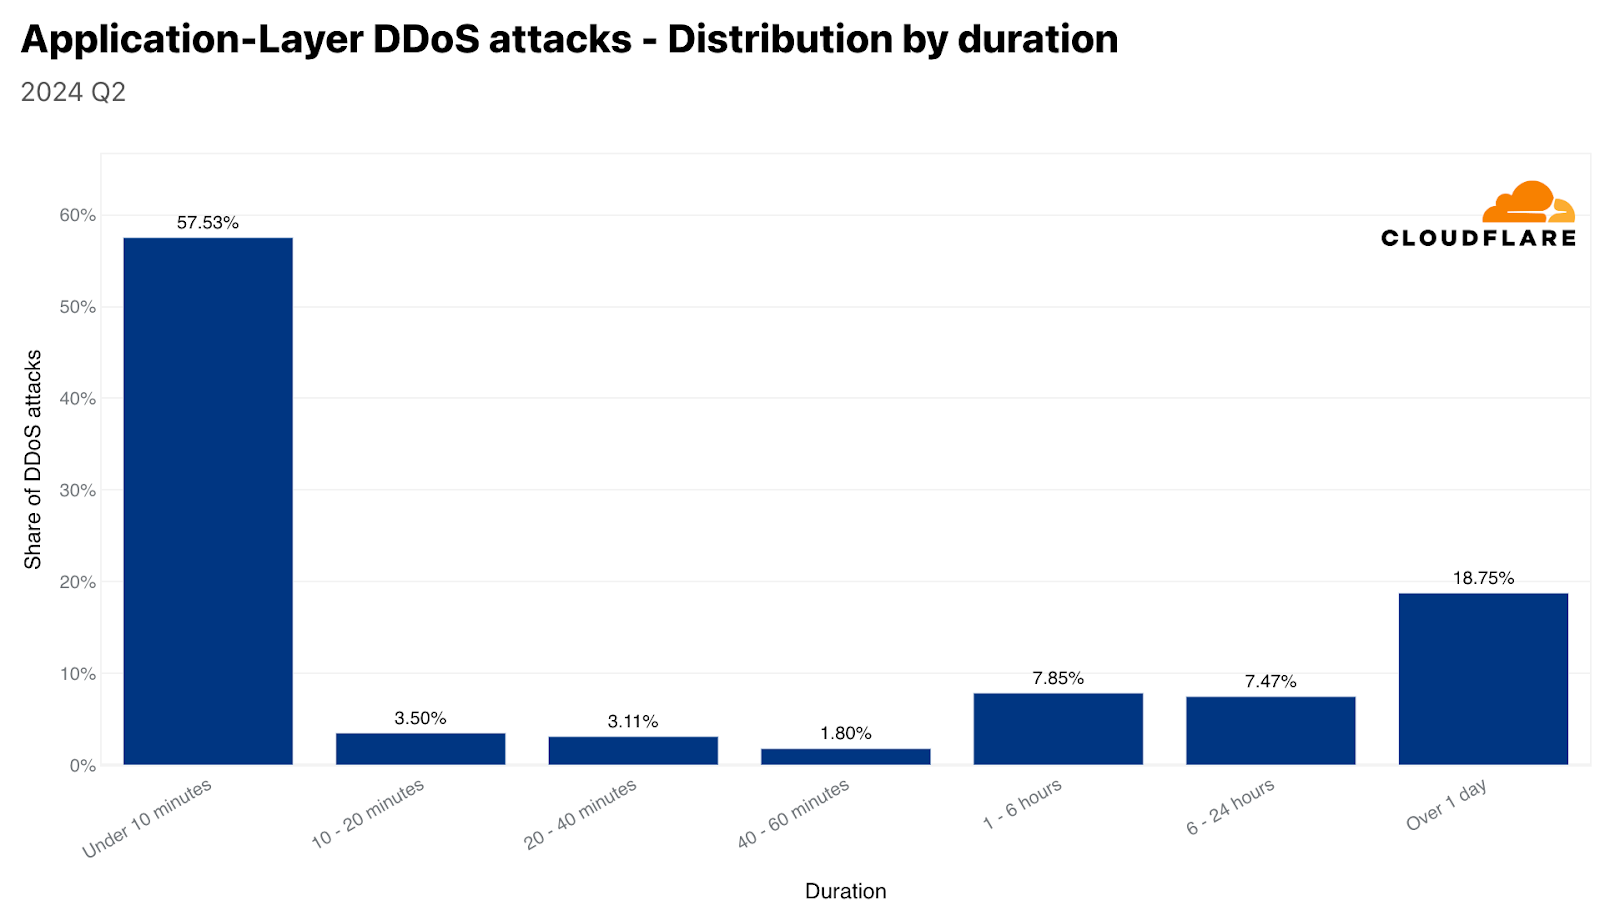
The vast majority of DDoS attacks are short. Over 57% of HTTP DDoS attacks and 88% of network-layer DDoS attacks end within 10 minutes or less. This emphasizes the need for automated, in-line detection and mitigation systems. Ten minutes are hardly enough time for a human to respond to an alert, analyze the traffic, and apply manual mitigations.
On the other side of the graphs, we can see that approximately a quarter of HTTP DDoS attacks last over an hour, and almost a fifth last more than a day. On the network layer, longer attacks are significantly less common. Only 1% of network-layer DDoS attacks last more than 3 hours.

DDoS attack size
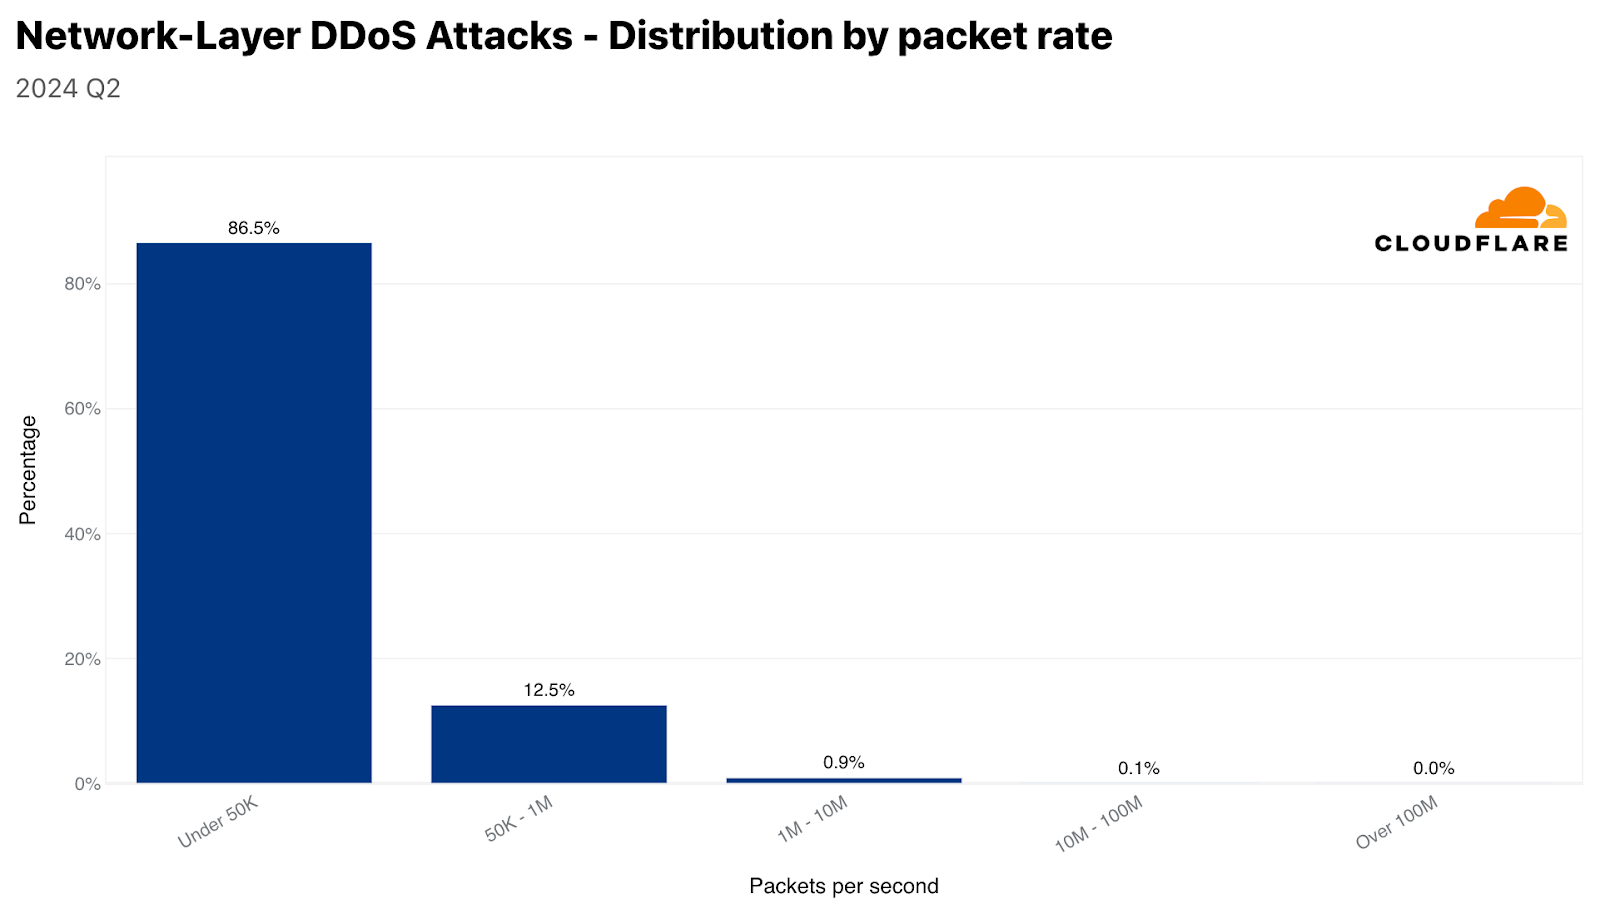
Most DDoS attacks are relatively small. Over 95% of network-layer DDoS attacks stay below 500 megabits per second, and 86% stay below 50,000 packets per second.

Similarly, 81% of HTTP DDoS attacks stay below 50,000 requests per second. Although these rates are small on Cloudflare’s scale, they can still be devastating for unprotected websites unaccustomed to such traffic levels.
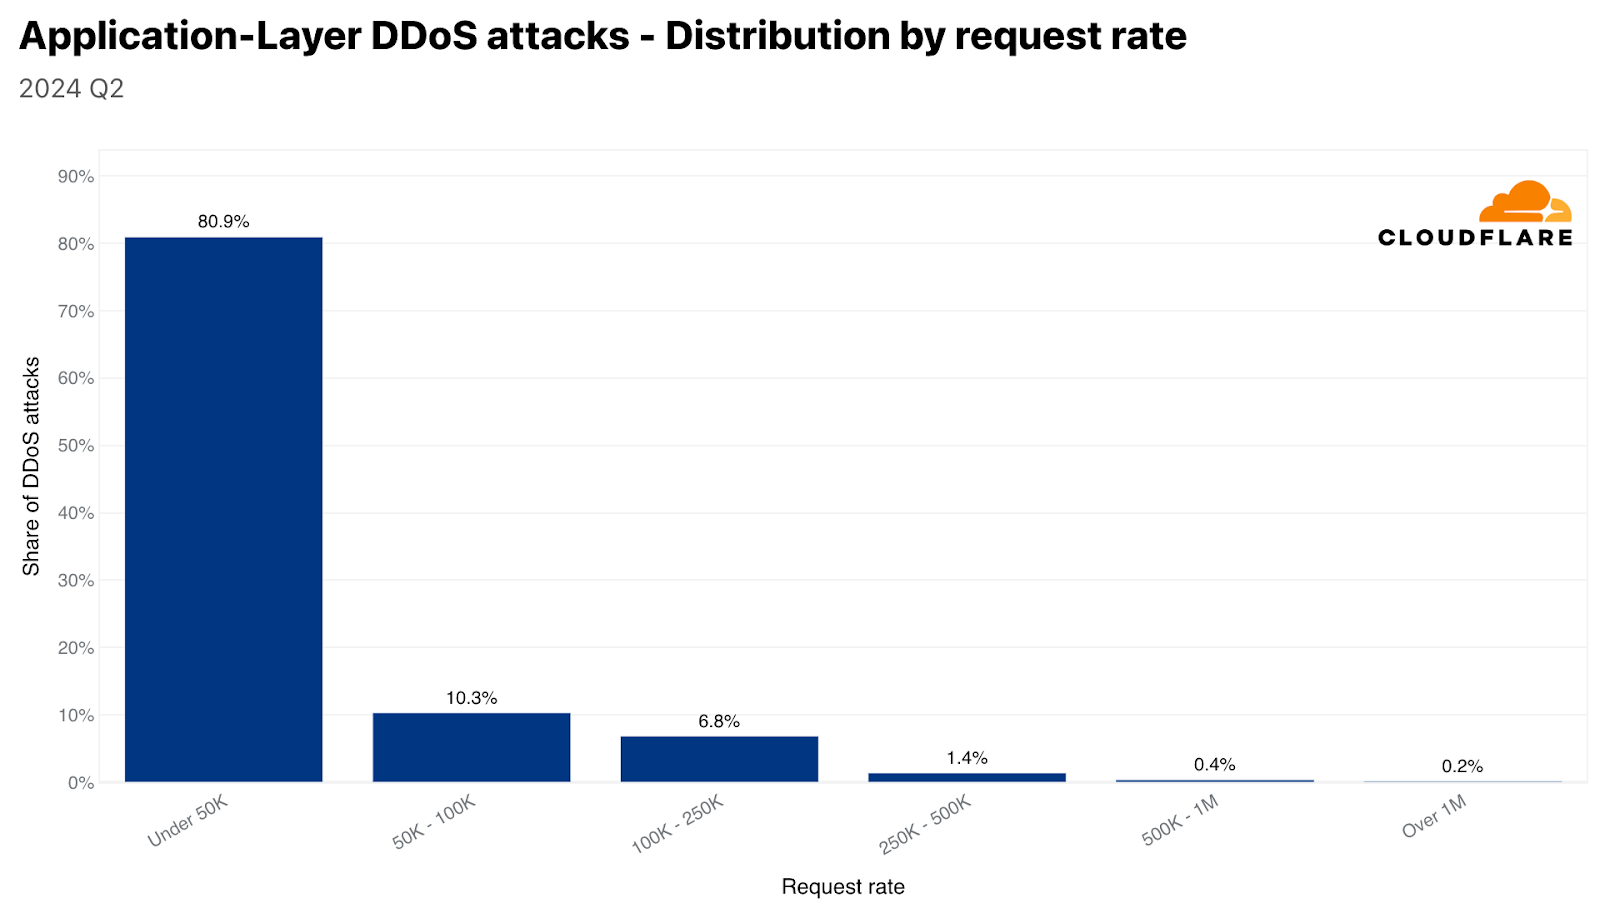
Despite the majority of attacks being small, the number of larger volumetric attacks has increased. One out of every 100 network-layer DDoS attacks exceed 1 million packets per second (pps), and two out of every 100 exceed 500 gigabits per second. On layer 7, four out of every 1,000 HTTP DDoS attacks exceed 1 million requests per second.
Key takeaways
The majority of DDoS attacks are small and quick. However, even these attacks can disrupt online services that do not follow best practices for DDoS defense.
Furthermore, threat actor sophistication is increasing, perhaps due to the availability of Generative AI and developer copilot tools, resulting in attack code that delivers DDoS attacks that are harder to defend against. Even prior to the rise in attack sophistication, many organizations struggled to defend against these threats on their own. But they don’t need to. Cloudflare is here to help. We invest significant resources – so you don’t have to – to ensure our automated defenses, along with the entire portfolio of Cloudflare security products, to protect against existing and emerging threats.